Tips for working with Geostationary Satellite Images using PyTroll
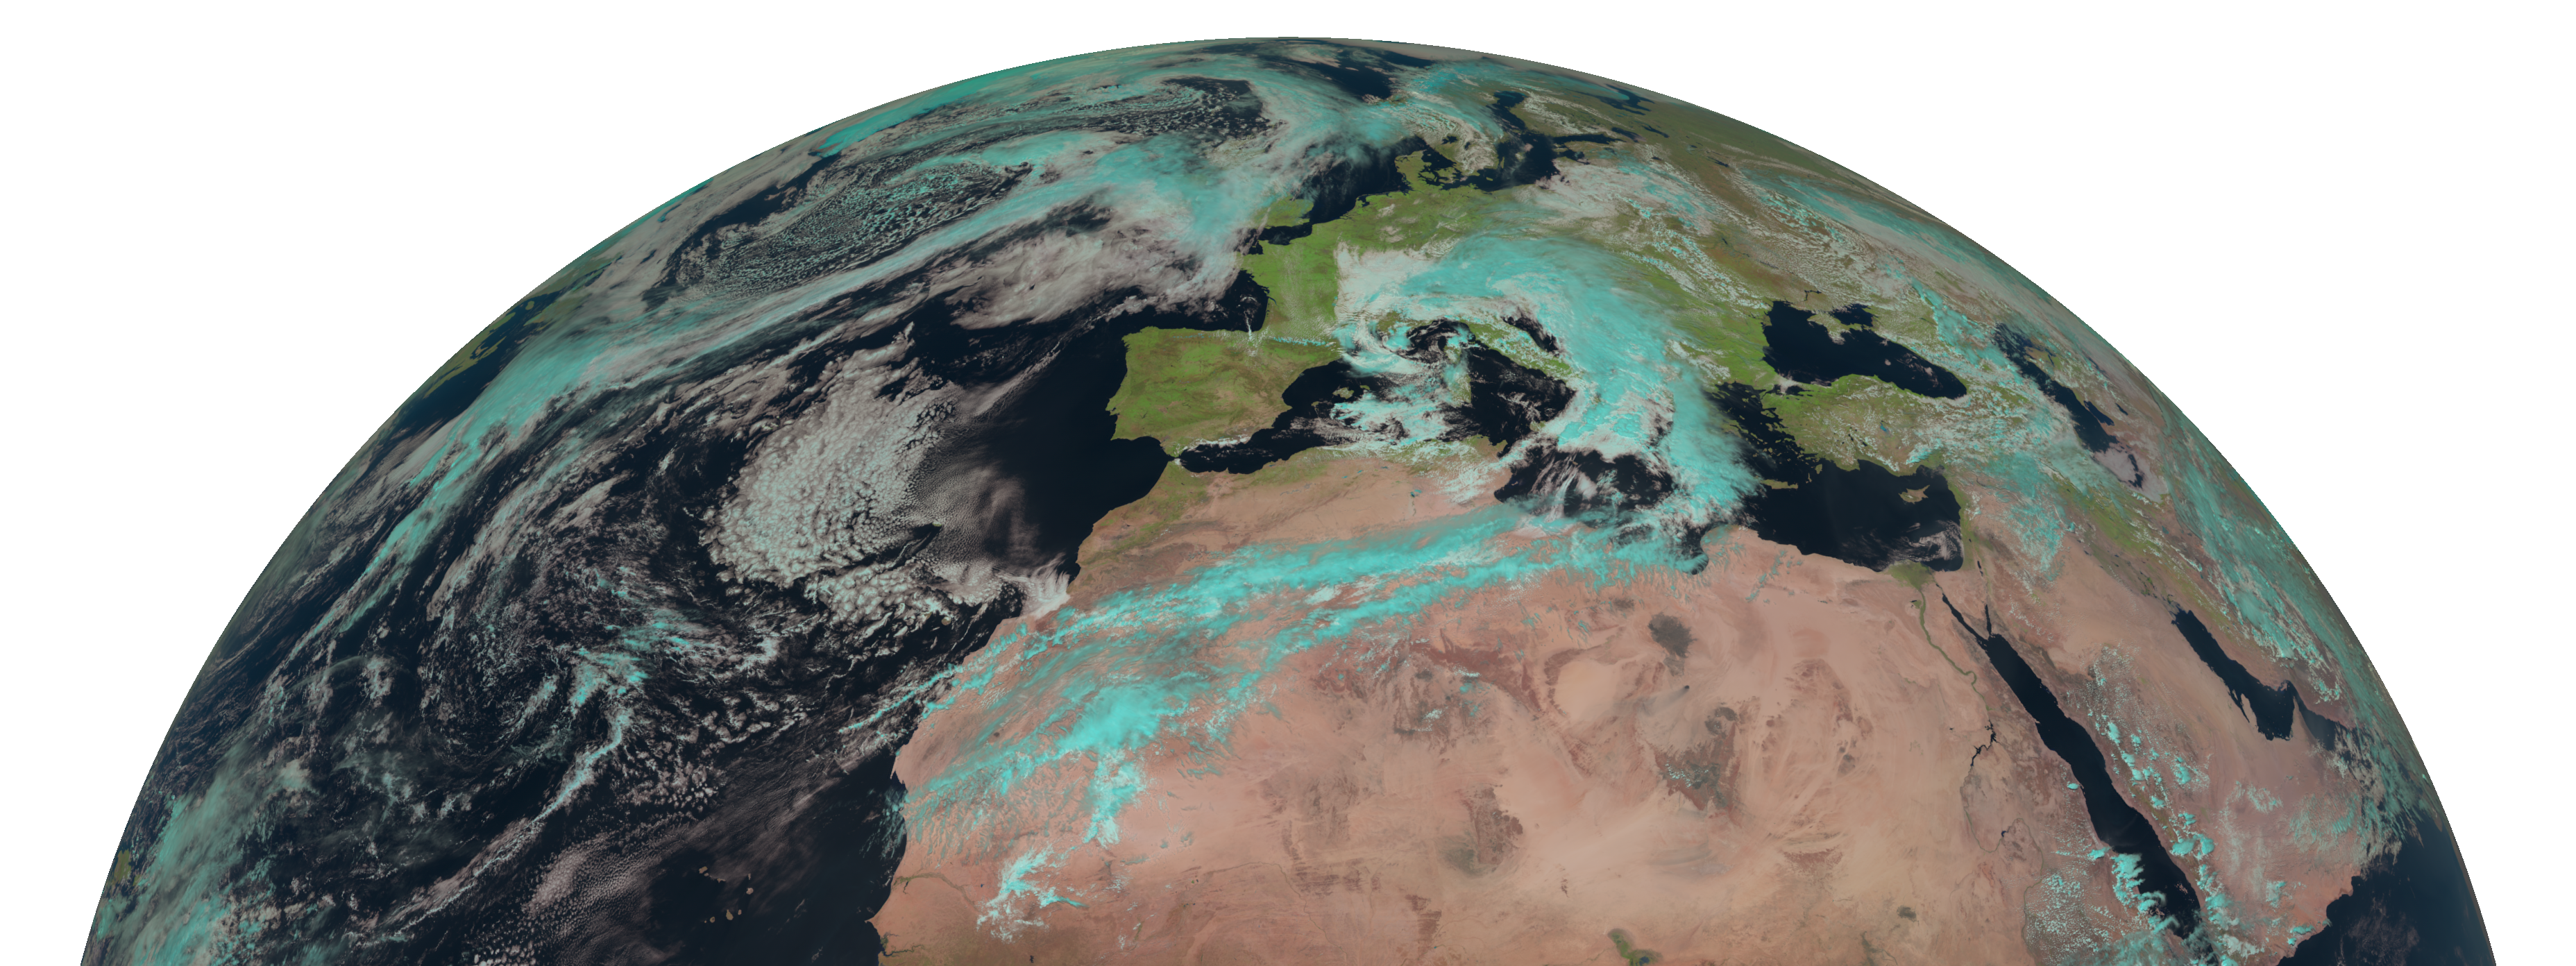
This post will include several tips for working with geostationary satellite images, which can often cause a lot of problems. I will primarily use the geostationary European Meteosat 2nd. Generation (MSG) satellites.
Projections using pyresample
Correct projections are absolutely essential before we can do any machine learning or analysis with satellite images.
Here we use the pytroll library - more specifically, satpy and pyresample. This means we use the PROJ.4 method to describe the coordinate reference system. You can find most relevant projection parameters for this method in the following pyresample documentation.
I will add some more examples of the various ways of defining and using projections for satellite images, but in my opinion this is the most general and consistent approach.
Example
Here we have the PROJ.4 parameters for the MSG satellites given in the above pyresample documentation document.
REGION: met09globeFull {
        NAME:          Full globe MSG image 0 degrees
        PCS_ID:        geos0
        PCS_DEF:       proj=geos, lon_0=0.0, a=6378169.00, b=6356583.80, h=35785831.0
        XSIZE:         3712
        YSIZE:         3712
        AREA_EXTENT:   (-5570248.4773392612, -5567248.074173444, 5567248.074173444, 5570248.4773392612)
}
Now we are ready to move into python.
import datetime
from pyresample.geometry import AreaDefinition
from satpy import Scene, find_files_and_readers


# We start by loading our satellite images
base_dir = '/path/to/your/satellite/image/'
reader = 'seviri_l1b_hrit'  # this is for the European Meteosat satellite images in the hrit format. They have several readers available, also for GOES satellite.
start_time = datetime.datetime(2017, 1, 1, 20, 15)
end_time = datetime.datetime(2018, 1, 6, 20, 15)

files = find_files_and_readers(base_dir=base_dir,
                               start_time=start_time,
                               end_time=end_time,
                               reader=reader)
scn = Scene(filenames=files, reader=reader)

# We define all our projection parameters
projection_name = 'MSG'
lon_0 = 0.0
a = 6378169.0
b = 6356583.8
h = 35785831.0
proj = 'geos'
height = 3712
width = 3712

lower_left_xy = [-5570248.686685662, -5567248.28340708]
upper_right_xy = [5567248.28340708, 5570248.686685662]

# we make an AreaDefinition from the pyresample package
area_def = AreaDefinition('areaD', projection_name, 'areaD',
                          {'lon_0': lon_0,
                           'a': a,
                           'b': b,
                           'h': 35785831.0,
                           'proj': proj},
                          height, width,
                          (lower_left_xy[0], lower_left_xy[1],
                           upper_right_xy[0], upper_right_xy[1]))

# We can now resample our scn to this projection and turn it into an xarray object
local_scn = scn.resample(area_def)
data = local_scn.to_xarray_dataset()

# We can also create a cartopy object from this if we want to plot our projection
crs = area_def.to_cartopy_crs()